PHP Test Coverage Tool
The PHP Test Coverage tool enables the collection and display of code coverage data on PHP software source code bases of arbitrary size. It is a member of SD's family of Test Coverage tools.
| Avaya uses PHP Test Coverage at many of their sites. |
PHP Test Coverage Features
- Available for PHP4 and PHP5
- Not dependent on PHP server configuration, nor XDebug (works with HipHop!)
- Works with arbitrary subsets of source code base
- Can accumulate data from multiple test runs
- Handles
tens of thousands of scripts - Extremely low probe overhead both in time and space; can be used on live production software
- Syntax checks all involved PHP scripts; find syntax errors before your users do
- Operations to combine Test Coverage data for unions, deltas, intersections
- Produces coverage report by file, class and method. The same report is available as XML to enable custom report generation.
- Test coverage collection can run on platform separate from Test Coverage tool
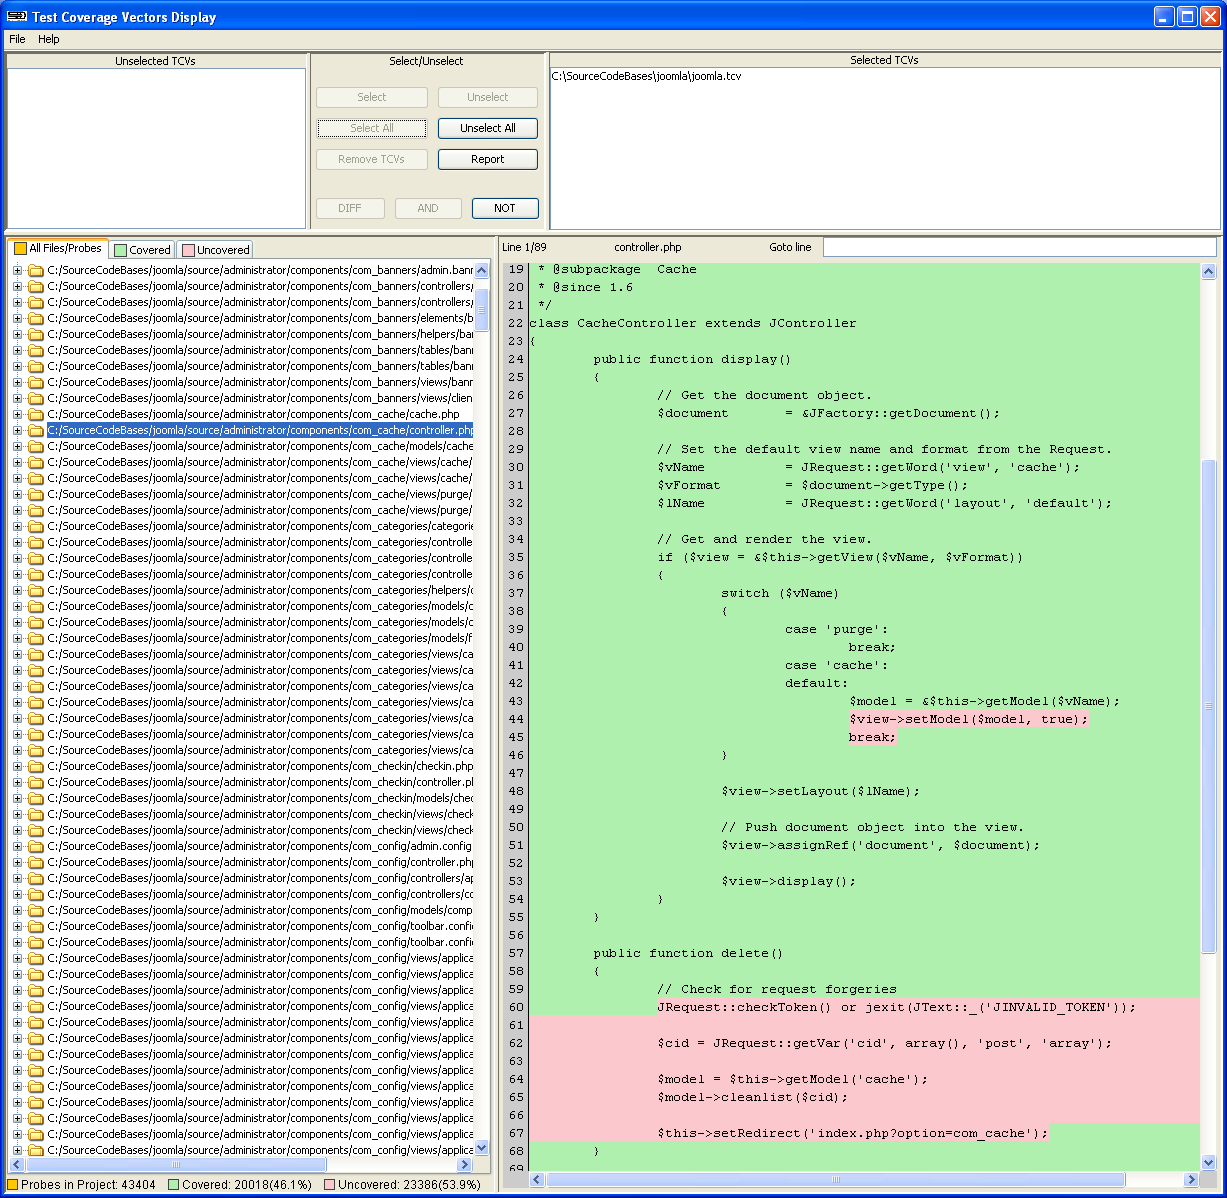
The PHP Test Coverage tool has an intuitively simple display. It shows
- Possible test coverage vector (TCV) result files
- Selected/accumulated/computed TCV files
- List of files being tested for coverage
- Locations of probe points in files
- Browsable source text of file of current interest
- Covered/uncovered status of each probe point on file source text
- Summary statistics for percentage covered

Here's a full-size screenshot (in a popup window) of the PHP Test Coverage display. If you have popups disabled, try this link: full-size screen shot. Green code means "covered (executed)". Red code means "uncovered (not executed)". In the example, note that line 43 is covered, and line 44 is not; this means that line 43 threw an exception that aborted execution and so line 44 never got executed. Also note that the system being tested (the open source Web framework Joomla) has 1078 files, 40000+ probe points and that the total coverage is some 46%.
Or ... download an evaluation copy
Semantic Designs also offers PHP Profiler Tools
